Introduction
Keeping track of significant business events in Google Analytics through annotations ensures that you have contextual information to interpret your data better. This guide will help you add annotations to your Google Analytics view, allowing you and your team to easily log and access important events.
Goal
To add an annotation to your Google Analytics view.
Ideal Outcome
An annotation is logged into Google Analytics and accessible by other Google Analytics users.
Prerequisites or Requirements
You need to have Google Analytics set up on your website. If you haven’t done so yet, you can follow SOP 009.
Note: The specific steps in this SOP apply only to Universal Google Analytics (not Google Analytics 4). If you set up Google Analytics before October 2020 or followed other Click Minded SOPs to create your Google Analytics account, you most likely have a Universal Analytics property.
Why This is Important
Analyzing Google Analytics data without proper context might lead to inaccurate conclusions. Events that affect your business (like a sale, a launch, or a competitor sale), your website (like a redesign), your marketing campaigns, or your Analytics implementation should all be considered while analyzing data. Annotating your Google Analytics ensures you have a solid logbook of what happened and when, allowing you to better interpret the data.
Where This is Done
In Google Analytics.
When This is Done
Every time there is an event that might impact your data on Google Analytics.
Who Does This
Everyone in the organization should be responsible for logging events of their respective business areas.
SOP Update: Google Analytics 4
Note: Google released a new version of Google Analytics in October 2020. This new version can be set as a property alongside the standard version “Universal Analytics”. Universal Analytics properties will likely be supported by Google for years to come. Currently, all Click Minded SOPs support Universal Analytics exclusively.
- To ensure you can follow this step-by-step SOP, make sure you have selected the Universal Analytics property once your Google Analytics account has been created.
- On the top left corner, click on the Account Dropdown and select a view within your Universal Analytics property (Not the GA4 property).
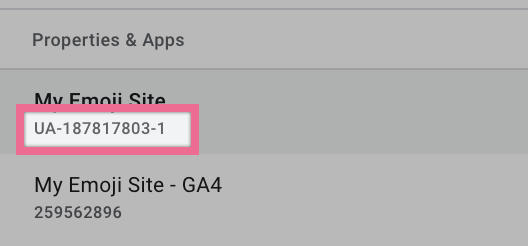
Note: You can identify your Universal Analytics property by noticing the ‘UA-’ prefix in the Property ID below its name.
Adding an Annotation
- Log In to Google Analytics
-
- Go to Google Analytics.
-
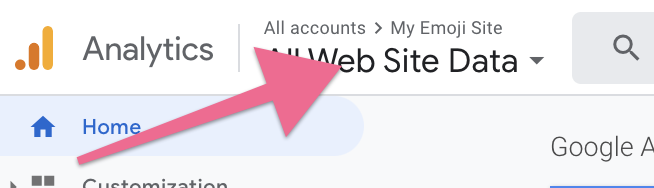
- On the top left corner, click on the Google Analytics view name.
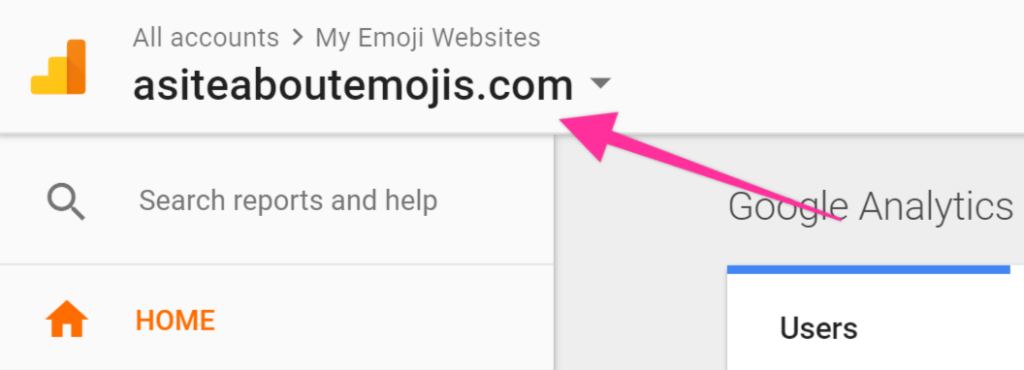
2. Select the View
-
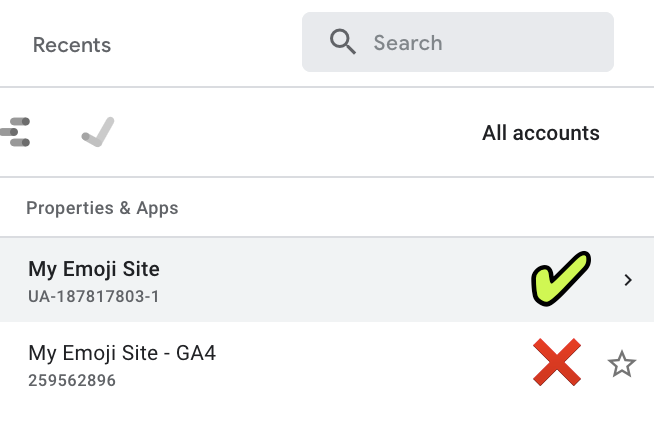
- Select the view to which you want to add your annotation.
-
- Note: Usually, you will want to add your annotations on your “Main” view. If you have not added any additional views yet, your view is named “All Web Site Data”. Ensure you are selecting a view that belongs to a Universal Analytics property.
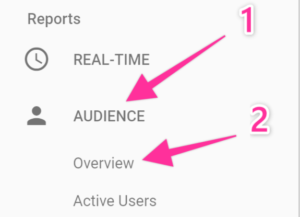
3. Navigate to Reports
-
- On the sidebar, under reports, click “Audience” → “Overview”.
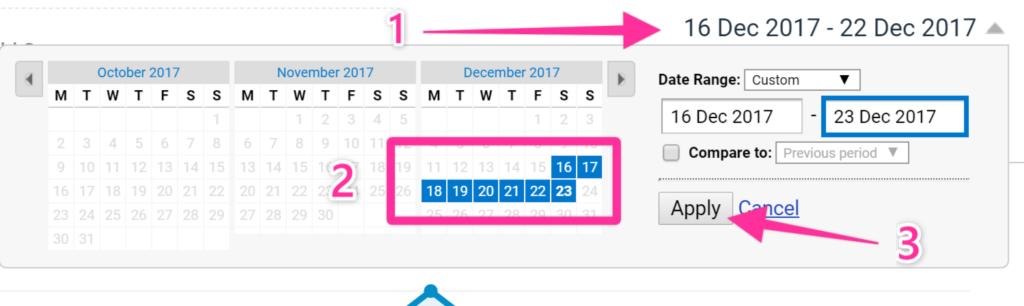
4. Select the Time Period
-
- On the top right corner, select a period that includes the day you want to include your annotation → Click “Apply”.
5. Create the Annotation
-
- Below the chart, click the down arrow icon.
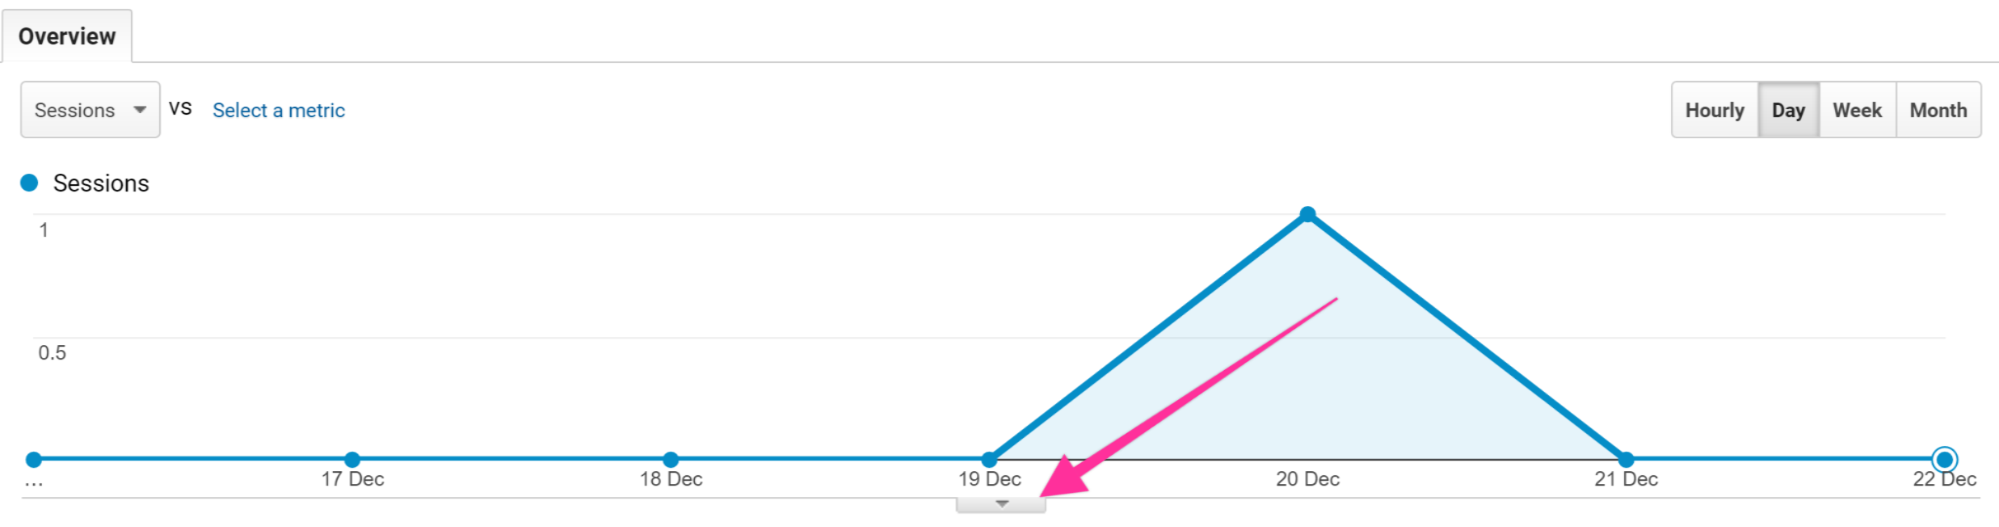
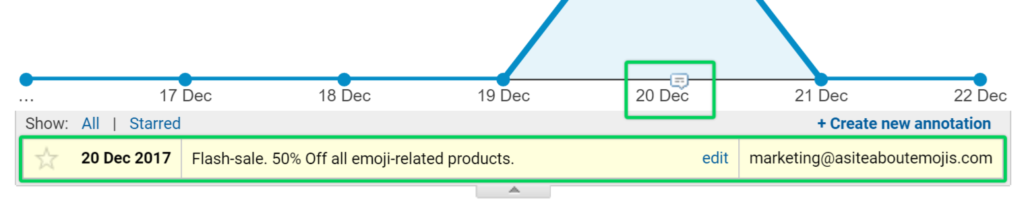
- Click “Create new annotation”.
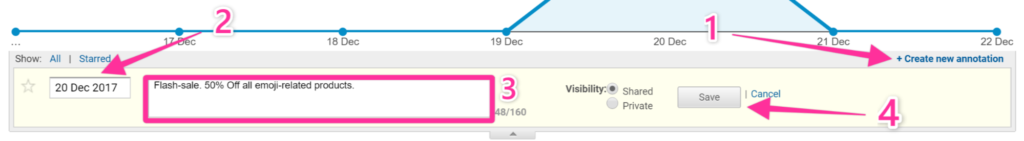
- Select the day you want your annotation to be logged in.
- Enter the text of your annotation.
- Click “Save”.
- Note: If you choose to create a “Private” annotation, it will only be visible to your Google Analytics account. A “Shared” annotation is available to anyone with permissions to access your Google Analytics view.
- Note: You need to have at least “Collaborate” permissions to create annotations.
That’s it! You’ve added your annotation. All annotations are displayed on the chart with a “Speech Bubble” icon, and simply clicking on them will allow you to read them.